
Properly Understanding Memory in x86_64: Some Assembly Is Required
If you’ve ever wanted to tackle OSCP, or been interested in how computers work at the lowest levels, you’ve likely bumped into memory.
It’s scary, it’s intimidating, difficult to visualize - honestly, I get it.
Heaps, stacks, buffers, buffer overflows, opcodes - what the actual hell does any of this mean?
That’s the intent of this deep dive article - making this scary, abstract concept easy to understand.
Getting your head around this has implications across all sorts of applications - especially if you’ve got aspirations to write your own exploits and shellcode one day!
Memory Dungeon
Instead of a dry wall of text, we’re going to use Memory Dungeon, a simple and modular program I put together to help teach people about memory.
You can find it and use it yourself along with the article here on GitHub.
Memory Dungeon is an interactive demo of heap memory, a stack frame and a disassembler - so you can see how these concepts work in real life, instead of just trying to visualize it all in your head.
If you can’t or don’t want to run Memory Dungeon yourself, that’s fine - we’ll be using a bunch of output and screenshots from running it on my computer, so you’ll be able to follow along.
Quest 1: Understanding How Memory is Laid Out in X86_64 Systems
Before we jump into the gnarly shit, let’s make sure we understand the basics.
Your computer will have both physical memory, like the stick of RAM memory pictured above, and virtual memory which is what your programs see.
What’s the difference, then?
When we talk about physical memory, we’re talkimg about how much physical, actual memory a computer has at its disposal to store data and handle programs/processes. You can add more physical memory by adding another stick of RAM if you have an open slot for it or by wholesale replacing the RAM stick you currently have if your device allows it.
Fundamentally, when you run a program, it’s all living in RAM for the most part - stored as bits.
When we talk about virtual memory, what we’re really talking about is a logical construct that presents RAM to your programs as this big, continuous address space it can use, even if in truth the data is spread physically all across the stick of RAM. Virtual memory allows for your OS to isolate processes from one another so they can’t stomp on each other’s memory allocations.
It also lets your OS offer the same consistent “map” or “architectural plan” to each process (which we’ll go through), which makes programming a lot easier.
So, when we describe the heap later on as growing upward or the stack as growing downward, we’re referring to this logical concept of virtual memory as opposed to the stick of RAM itself.
So what does the “map” look like?
High addresses
+----------------------------+ <- Kernel space (off-limits to user code)
|                            |
|        (unused gap)        |
|                            |
+----------------------------+ <- Stack (grows downward)
|     Local variables        |
|     Saved frame pointers   |
|     Return addresses       |
+----------------------------+
|     Memory-mapped files,   |
|     shared libraries       |
+----------------------------+
|     Heap (grows upward)    |
|     malloc/new allocations |
+----------------------------+
|     BSS (uninitialized     |
|     global/static vars)    |
+----------------------------+
|     Data (initialized      |
|     global/static vars)    |
+----------------------------+
|     Text / Code segment    |
|     Machine instructions   |
|     (e.g., 0x90 = NOP,     |
|            0xC3 = RET)     |
+----------------------------+ <- Low addresses
You’re probably looking at that and going “wait, what the actual f**k?”
Don’t worry, we’re going to break each part of it down from top to bottom so you get what each and every part is doing.
🏰 Kernel Space – “What Do You Mean I Can’t Touch It? I Thought This Was America?”
When you install an operating system (OS) on your device, one of the most core pieces of that operating system (whether you’re a priest of the Church of Microsoft, or a disciple of the Church of GNU/Linux) is the kernel.
The operating system kernel is the core part of your OS that handles the actual hardware interactions that make your computer run, make sure your keystrokes actually do anything, handle physical memory and device drivers etc.
⚔️ Why it’s off-limits: If any old program could touch this space, it could crash the entire computer just by poking into the wrong bit of memory - and that is no bueno if you were planning on using it.
So, a very strict boundary is drawn around what we call kernel space where the OS lives and handles its business, and user space or user land where the programs you write and use live and handle their business. If your program tries to touch kernel space, the OS raises a fault and kills it stone dead.
So, that’s why it’s off limits at the top of our diagram, here!
🥞 The Stack – I’ve Been Framed, I Tells Ya!
We met the stack briefly in the memory map above, but let’s zoom in.
If a single line of code is an instruction, then a collection of instructions that do a certain conceptual thing is a function. Calling a function like swap() or run_heap_demo() means: “hey computer, jump over there, do this little subroutine, then come back.”
The stack keeps track of all those calls by storing each one inside a stack frame.
A stack frame is like a little apartment with a few important floors:
- One for local variables (e.g.,
char buf[16]). - One for a saved frame pointer, which links this frame to the one below it.
- One for a return address, so when the function finishes the CPU isn’t just like “Uh… now what?”
Each new frame goes on top of the previous one. The stack starts at high memory addresses and grows downward as functions are called. When a function finishes, its frame vanishes and the stack shrinks back upward.
Think of it like pancakes: new pancakes go on top, you eat the ones that came first. If a diner slid fresh pancakes underneath the stack, you’d call the cops.
💡 Here’s the kicker: if you put too much data into one of those local variable floors, it can spill into the floors above it — smashing the saved frame pointer and return address. That’s where the term stack smashing comes from… but we’ll get to that in Quest 3.
🏢 Memory-Mapped Region – It’s All libc, Baby!
So between the stack which grows downwards and the heap which grows upwards, there’s this space in-between.
This space is kinda like a “shared housing block” where your OS drops in extra stuff your program needs, and that your program files are utilizing to get their jobs done.
We call this part of memory the memory-mapped region. It’s the rent-controlled apartment building of RAM!
When you call printf(“Go Birds!”) you’re using the printf() function which is part of the libc library. This is a library of code provided by your system so that multiple files can use it, instead of having multiple copies inside each file.
That’s why they’re called shared libraries - because they are! Think of it like giving everyone in the apartment building the key to the same laundry room and community room that anyone can use should they need it.
🛎️ The Heap – Growing Ever Upwards, Much Like My Caffeine Intake
Further down the diagram, we arrive at the heap.
Think of the heap like a long hotel hallway, with rooms off to both sides. Your operating system is the hotel manager, and whenever you ask for memory with malloc(), it hands you the key to a set of rooms. When you’re done, you’re supposed to check out with free() so those rooms can be reused.
Unlike the stack, memory here doesn’t automatically disappear when a function ends. The heap requires active management. If you forget to free memory, the hotel manager can’t give those rooms to anyone else — that’s a memory leak. If you free them twice, you’ve caused corruption in the hotel’s booking system. And if you wander into a room you didn’t rent… well, that’s how segfaults happen.
This explicit responsibility is one of the biggest cultural shocks when moving from higher-level languages like Python or JavaScript (which have garbage collectors to clean up after you). In C, you are the garbage collector.

The heap starts at lower-number memory addresses and grows upward the more your program requests at runtime. If that program happens to be Google Chrome, you can safely assume the entire hotel is booked solid (hayooooo).
We’ll dive into the heap in more detail in Quest 2: Heap Hallway, where you’ll get to walk the corridor yourself.
🗄️ BSS Segment – The Junk Drawer. Nobody Knows What It Means, But It’s Provocative
We do actually know what BSS stands for (Block Started by Symbol), and it’s a reference to old-school disassembler programs that kinda stuck.
But, I wanted to make the Blades of Glory reference, so that took precedence here 😂
This part of memory is actually pretty simple to understand - it’s where uninitialized global (program-wide) and static variables live.
If I declare static int counter, but don’t give it a value - it would get stored in the BSS segment, and the OS will initialize it at 0 when we run the program.
The BSS Segment is the junk drawer full of stuff you swore you’d use but just haven’t gotten around to yet.
You’re absolutely going to use those 8 dead batteries and a key to a house you don’t own any more, right?
📦 Data Segment – Does What It Says on the Box
This is where initialized global and static variables live that have actually been given a value.
So if you instead declared static int counter = 42, it’d live here in the Data Segment of memory.
Not really all that much to this one, to be honest!
📜 Text Segment – Mom, Come Pick Me Up, There’s A Scary Man Here Offering Me Opcodes
Welcome to the bottom of the memory diagram - this is where the fun part is!
This segment of memory is also sometimes called the code segment of memory.
The text or code segment is where the actual instructions you write in your programs live once they’ve been compiled into a single executable file that the computer can actually run.
Your computer doesn’t store things here in a language you or I understand, though.
It stores what we call raw bytes or opcodes that correspond to a specific instruction that the CPU gets sent.
Those opcodes are normally associated with a human-readable mnemonic so in general, we can understand and trace the flow of executing instructions through the program.
We call that human-readable language assembly language and it’s about as close as we’re able to get to speaking raw machine language ourselves.
📜 Opcodes, not assembly: The CPU doesn’t see NOP or RET. It sees bytes like 0x90 or 0xC3 and decodes them into actions. Assembly is just our human-readable shorthand for what those bytes mean. We can transform these raw bytes back into human-readable assembly language using a program called a disassembler and we’ll be going through how it works in Quest 4!
Quest 2: Heap Hallway - How Many Rooms Do We Have and How Many Are Left?
Alright, now it’s time to break out Memory Dungeon and dive a little deeper into the main sections of memory you’re gonna be playing in.
Like we referenced above, the heap is a section of memory that we can dynamically allocate and free in our program and needs active management on our part to avoid problems at runtime.
If you’re running Memory Dungeon yourself, make sure you’ve followed the build instructions and then run the following command:
./memory_dungeonThis will bring up the main menu of Memory Dungeon (as you can see in the screenshot), where you can pick which demonstration you want to see.
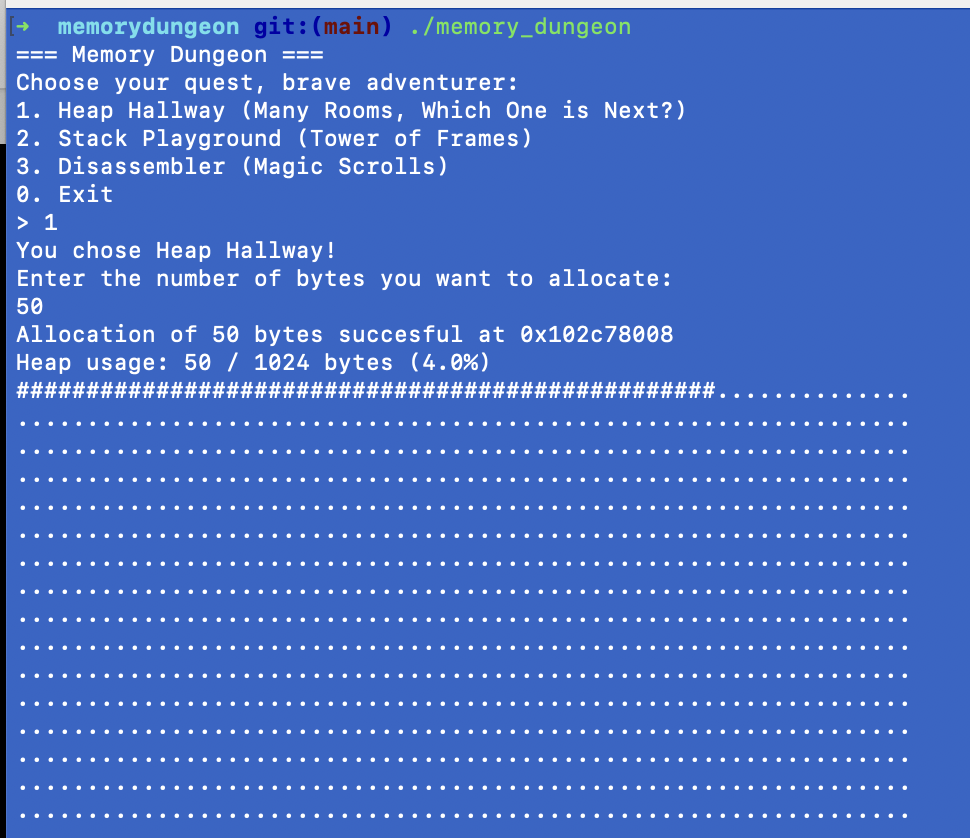
You want to pick number 1 - Heap Hallway.
Remember when we said that the heap grows upwards in memory as we ask for more of it? Well, this is where you’ll get to see that happen in real-time!
Heap Hallway has a “heap” of 1024 bytes available for you to allocate - so if you remember our hotel hallway analogy from before, that’s one hallway with 1024 rooms to allocate.
The program then asks you how many bytes you want to allocate from the heap - I put 50 here, but any number between 1 and 1024 would work.
Whenever a program calls malloc(), this is the equivalent of what you’re doing when you type in your first number. You’re asking the OS (the hotel manager in our analogy) to book and take up 50 rooms accessible via the hallway.
You can see once I type in 50 and hit enter, 50 # symbols appear in our block of . symbols, representing 50 bytes of heap memory being taken up. The heap has grown upwards by 50 bytes!
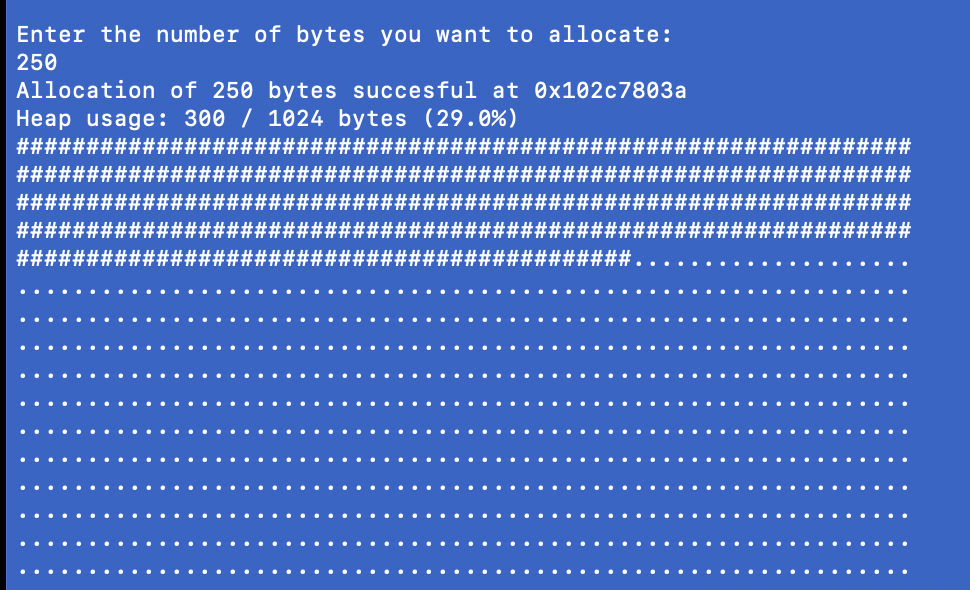
The program will then ask you again for a number of bytes to allocate - I chose 250 here, but again, any number between 1 and 974 would work here (because we allocated 50 already).
You can easily see that a lot more # symbols appear in the grid, representing the 300 bytes of heap memory we’ve allocated. The heap has grown upwards by 250 bytes!
What about if we want to allocate another 800 bytes?
Anyone who has finished basic math will go “Hang on a sec, 300 + 800 = 1100. 1100 > 1024, so what happens when we run out of rooms?”
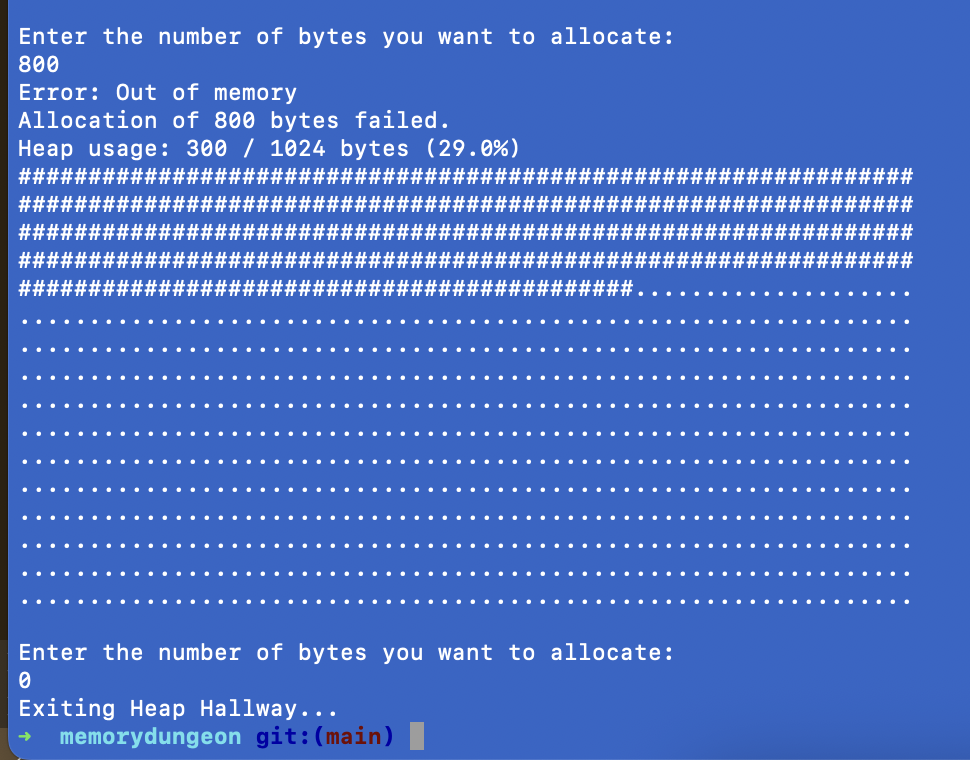
If you keep asking for more and more rooms, eventually the hotel manager (your OS) will throw up their hands, like so:
Enter the number of bytes you want to allocate:
800
Error: Out of memory
Allocation of 800 bytes failed.
Heap usage: 300 / 1024 bytes (29.0%)
Notice how the heap usage percentage and amount stayed the same? The allocation didn’t succeed and the program threw an error, so the hallway allocation didn’t change.
If we free()-d up some rooms, we’d have been able to allocate the rooms and the allocation would have been successful. But we didn’t, so we weren’t able to - hence the error.
If you don’t clean up after yourself with free(), the hallway/heap fills up over time. If you ask for more rooms/bytes than are available, you get NULL back. If you haven’t accounted for that in your code, you’ll start getting weird behavior or errors in your programs.
It’s a simple demo, but there’s real world security implications for this!
If you ever find yourself looking at something called a “heap exploit”, what it’s likely taking advantage of is a flaw in the “booking system” for hotel rooms in the heap.
If the computer can’t keep track of which rooms are occupied, maybe the attacker can trick the OS into handing the keys to a specific room that they shouldn’t be allowed into…
Quest 3: Stack Playground - Causing the Buffer Overflow By Yelling Too Much At It
Now, let’s have some fun poking around the stack!
If you remember our analogy from above, this is where our little stack frame “apartments” with their separate floors are. The stack is where the computer deals with function calls made within our programs at runtime.
If you’re running Memory Dungeon yourself, make sure you’ve followed the build instructions and then run the following command:
./memory_dungeonThis will bring up the main menu of Memory Dungeon (as you can see in the screenshot), where you can pick which demonstration you want to see.
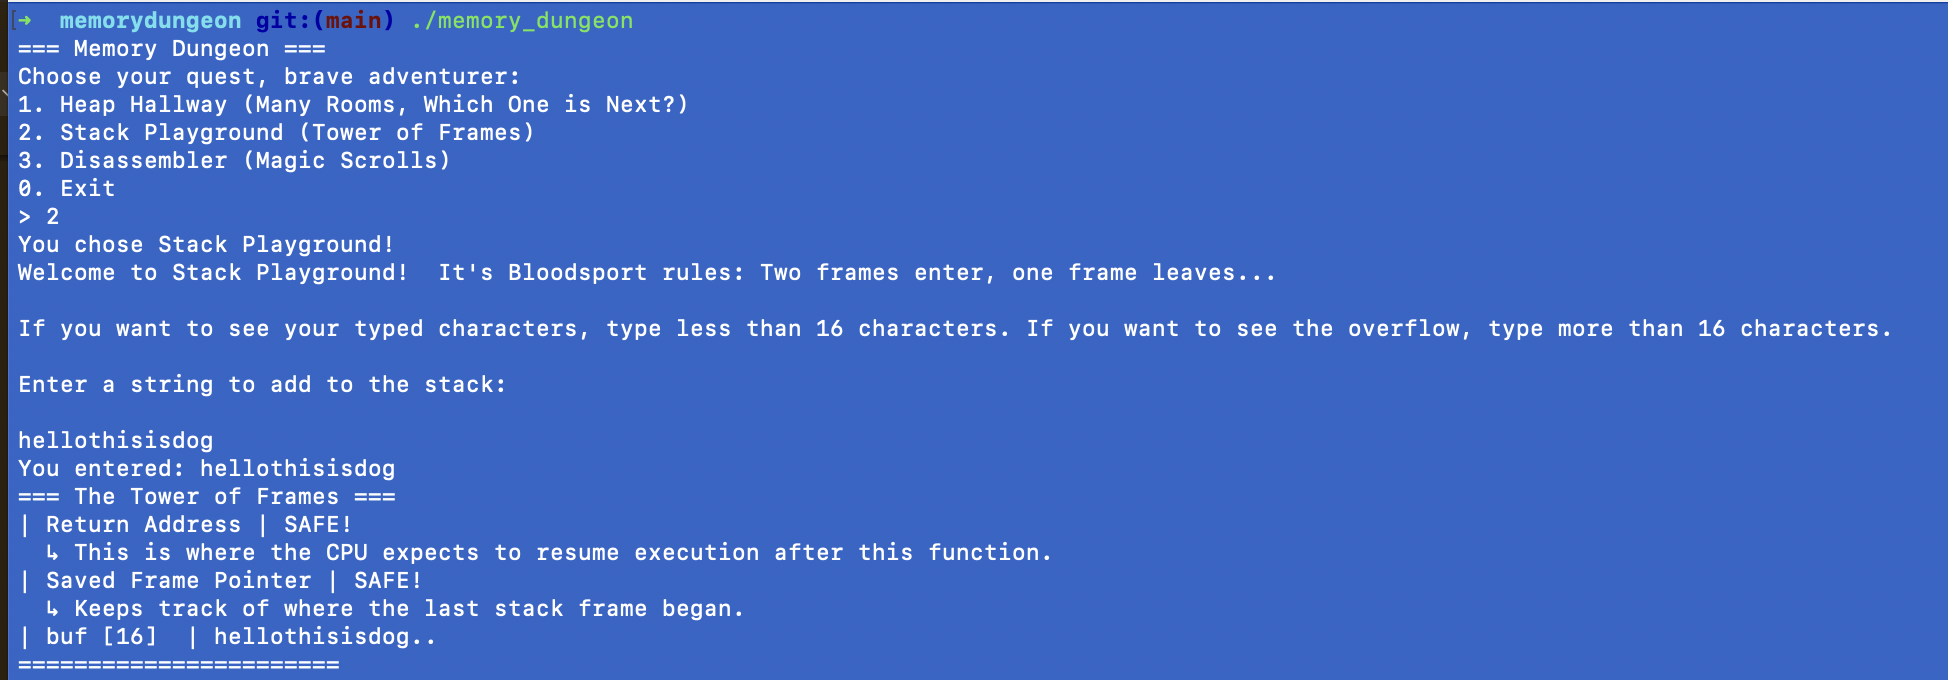
You want to pick number 2 - Stack Playground.
Let’s dive a little deeper into what’s happening here:
We have a stack frame that you can see in the picture, and the local variable stored within that frame is a buffer of 16 characters. That’s how big the “floor” is here for storing data, 16 characters.
Inside each frame are a few critical “floors”:
- Local variables (like char buf[16]).
- Saved frame pointer, linking this frame to the one below it.
- Return address, which tells the CPU where to go when the function ends.
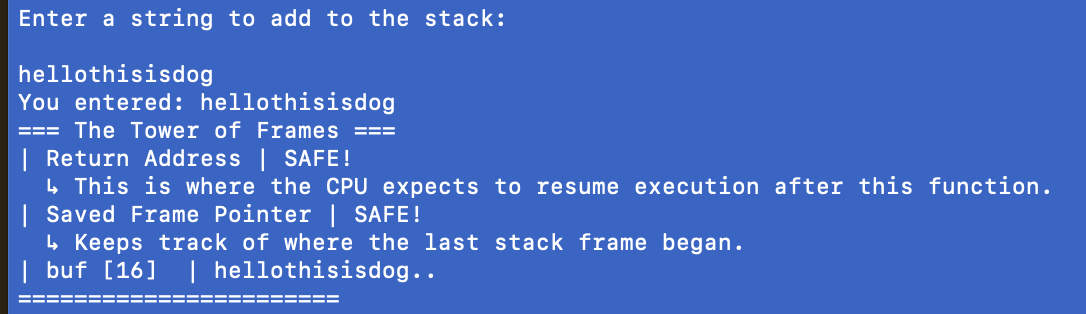
We typed the string “hellothisisdog”, which is 14 characters and gets stored just fine in buf, as you can see.
Normally, things fit inside the buffer and everything is good in the hood. No mess, no stress.
But, that wouldn’t be much fun - so we’re going to see what happens when we try and ram too much information into a buffer not designed to hold that much!
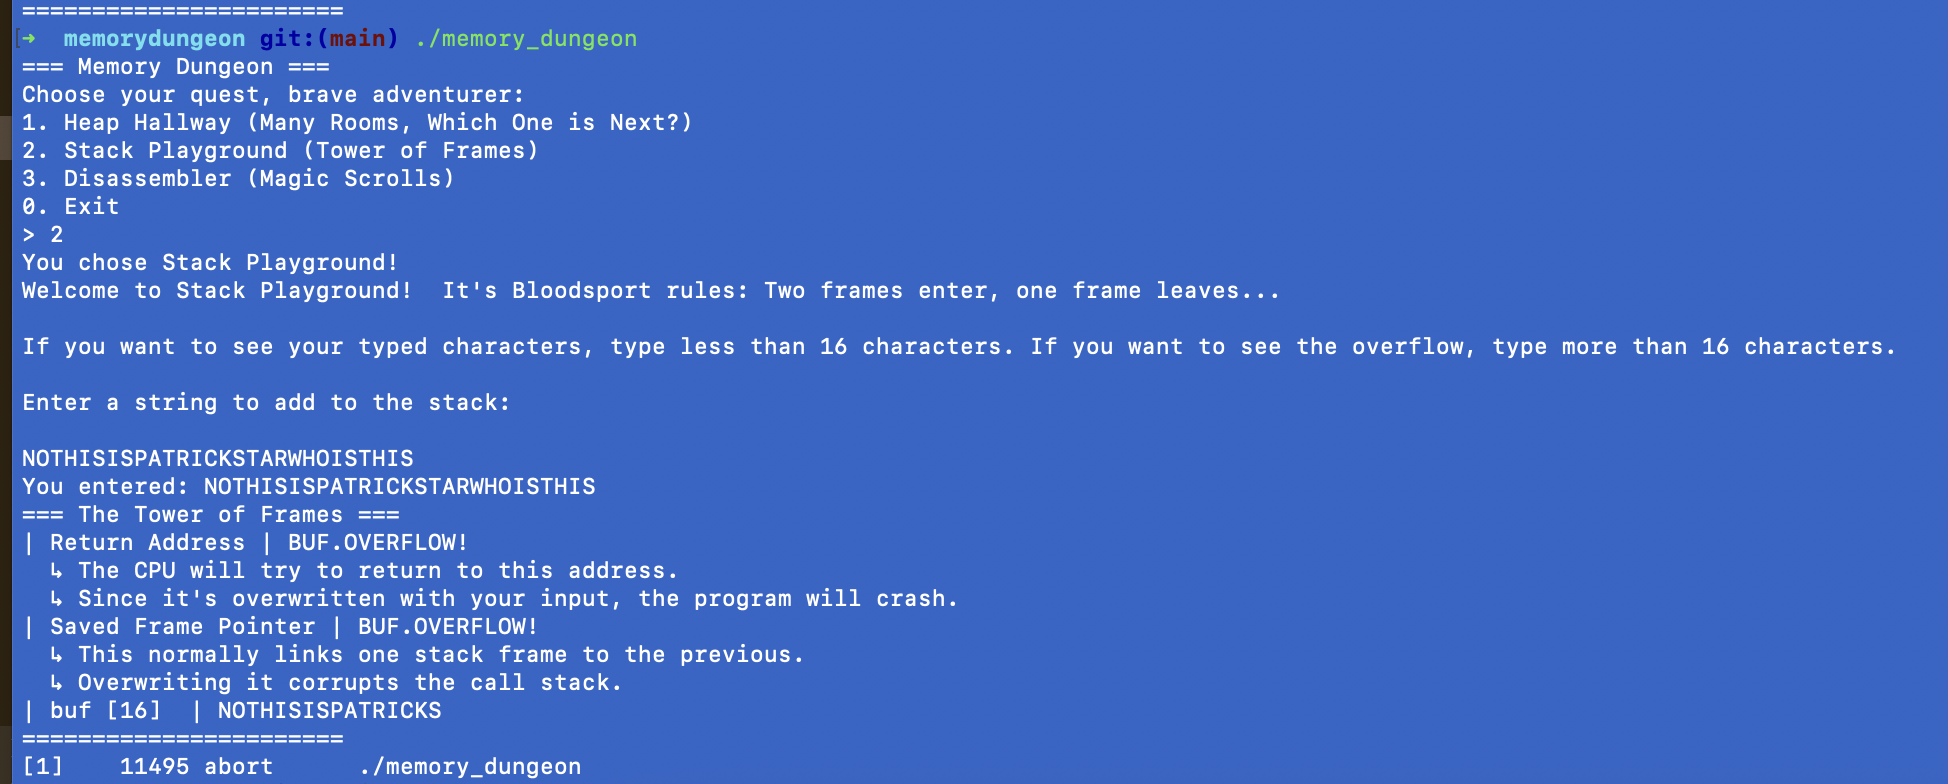
This time, we’re going to type in the string “NOTHISISPATRICKSTARWHOISTHIS”, which is 28 characters and anyone who passed basic math can tell you that that is more than 16 characters!
Now what?
Our string overflowed past the buffer’s 16 bytes and overwrote both:
- The saved frame pointer, so there’s no link to the frame below it now,
- The return address, so there’s no directions for the CPU to follow after the function executes.
The CPU then tries to navigate to an address that doesn’t exist because it’s all garbage data from our string, and the program crashes - as you can see!
Let’s look at another example, where we’re just gonna scream AAAAA a bunch (just as a lil’ treat) as our string this time, and see what happens:
Enter a string to add to the stack:
AAAAAAAAAAAAAAAAAAAAAAAAAA
You entered: AAAAAAAAAAAAAAAAAAAAAAAAAA
=== The Tower of Frames ===
| Return Address      | BUF.OVERFLOW!
| Saved Frame Pointer | BUF.OVERFLOW!
| buf[16]             | AAAAAAAAAAAAAAAA
=======================
It’s way more than 16 bytes and we overflow poor old buf and not just that, but the return address and the saved frame pointer, too.
Process stopped
stop reason = EXC_BAD_ACCESS (code=257, address=0x4141414141414141)
What’s happened here, then?
The CPU just tried to jump to the memory address 0x4141414141414141, which if you translate it back into ASCII is just “AAAAAAAAAAAAAAAA”. The CPU cannot jump to a memory address that doesn’t exist, and the program crashes.
We have just performed something called a stack smashing attack, which is a form of buffer overflow attack.
A buffer overflow happens when (as you saw) you ram more data into a buffer than it can hold. On the stack, that means we’re overwriting really important information the CPU needs to execute programs properly, like saved frame pointers and return addresses.
There are modern protections against simpler overflow attacks like the stack smashing we just did here, but modern exploits rely on pointing that return address not to garbage output like “AAAA” but instead to malicious instructions that execute what the attacker wants - shellcode.
This is why input validation (checking what comes into a program) is so important from a development perspective, and also why fuzzing (injecting different types of data into inputs to see what happens to the program) is such an important tool for security researchers!
Quest 4: I Love Magic Scrolls, Disassemble Another Opcode For The Jukebox, Baby
With Heap Hallway and Stack Playground, you’ve now seen how memory is allocated and how it can be smashed.
Next up, we descend into the archives to decipher the Magic Scrolls of Opcodes.
If you remember from our memory tour above, the text segment or code segment of memory is where our actual program instructions live once you’ve compiled them.
But, here’s the thing: your CPU can’t read your beautiful C code. It can’t even read assembly language the same way you and I (well, the people who are nuts enough to learn it) can!
So what is stored here, then?
At the lowest level, instructions to the CPU are just bytes, sequences of 1s and 0s (binary) that the CPU knows how to interpret.
The set of sequences a given CPU can understand is called its instruction set and there’s a different instruction set for different CPU types, or architectures. So if youre trying to write exploits for an ARM-based CPU, you’d need to work with the ARM instruction set. Here, we’re working with the x86_64 instruction set, which is an extremely common 64-bit instruction set on millions of devices worldwide.
Think of this layer as being like a really nerdy slice of cake with three distinct layers of “meaning”:
- Assembly Language - The human-readable shorthand for opcodes, and forms a language that you could ostensibly write a program directly in, should insanity briefly overtake you.
- Opcodes - These are specific sequences of 8 bits (bytes) that correspond to a specific instruction. They’re represented in a form called hexidecimal and are still technically “human-readable”.
- Machine Code - The raw binary stream of 1s and 0s that flow through the CPU of your device. This is NOT human-readable, though I imagine there’s some psychopath out there who’s just thought “BET” and is going to learn, now I’ve said that.
The CPU only understands machine code, we use opcodes to write the instructions down, and we use assembly language to make sense of them.
You can use a program called a disassembler to turn the bytes back into human-readable instructions, and that’s what the third room of Memory Dungeon is simulating!
If you’re running Memory Dungeon yourself, make sure you’ve followed the build instructions and then run the following command:
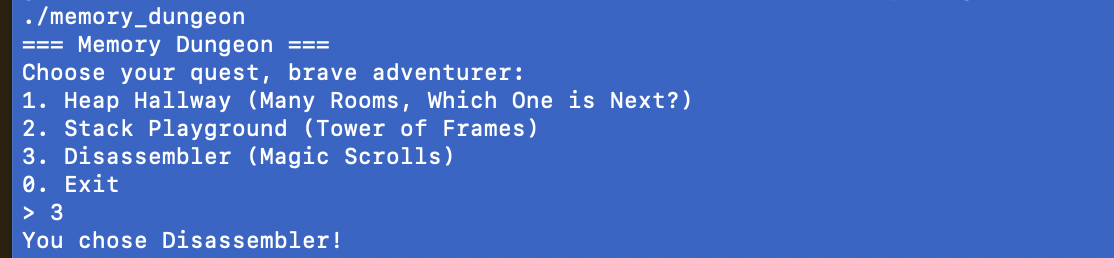
./memory_dungeonThis will bring up the main menu of Memory Dungeon (as you can see in the screenshot), where you can pick which demonstration you want to see.
You want to pick number 3 - Disassembler.
Inside the code for Disassembler is a “magic scroll” of bytes I hardcoded into the default Memory Dungeon, that correspond to instructions.
We’re going to take a look to see what they mean!
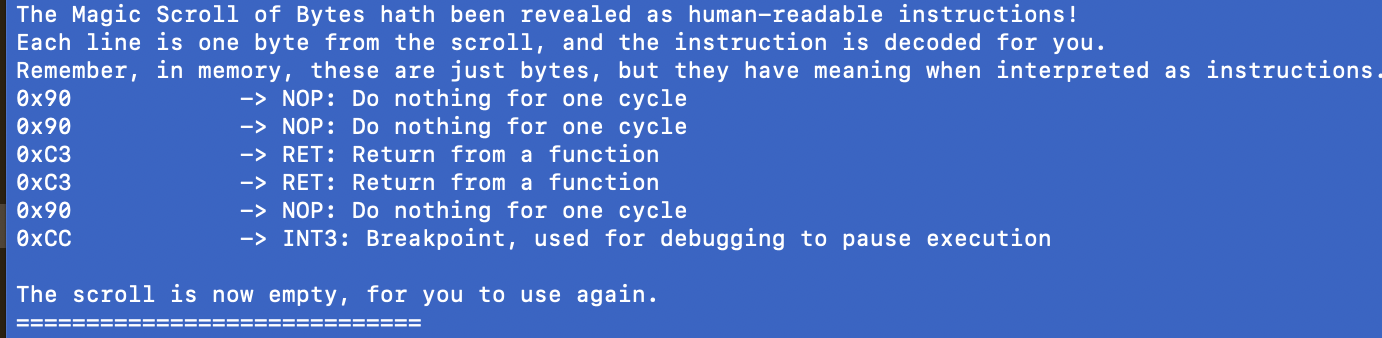
A disassembler is just a program that translates raw byte opcodes into human-readable names that correspond to instructions we understand as people.
Let’s take a look at a few of them from the screenshot:
| Instruction | Assembly | Opcode (Hex) |
|---|---|---|
| Do nothing | NOP | 0x90 |
| Return | RET | 0xC3 |
| Breakpoint | INT3 | 0xCC |
- If a byte in memory says 0x90 then that corresponds to an assembly instruction of NOP, which means “please do nothing for 1 CPU cycle”.
- If a byte says 0xC3, it corresponds to an assembly instruction of RET, which means “please return from this function”.
- If a byte says 0xCC, it corresponds to an assembly instruction of INT3, which is a breakpoint. Breakpoints are pauses in execution of a program that are very useful when trying to debug a program for testing or exploitation purposes.
So when we say your CPU is “running a function”, what it’s really doing is stepping through memory, one opcode at a time. Those opcodes are translated into 1s and 0s that correspond with the byte/instruction set, and are sent to the CPU to execute.
But how does your CPU feel about all this?
It neither knows nor cares what NOP is, NOP is for us weak flesh-based lifeforms that have not yet ascended. It knows only…10010000
Wrapping Up: Memory Is Dope, You Can Do Dope Stuff With It, Such as…
So, what have we done here today?
We’ve:
- Broken down the various sections of x86_64 memory and understand what each one is for,
- Walked up and down Heap Hallway and learned how we can dynamically book and free up “hotel rooms”, plus what happens when we DON’T free them up!
- Took a look inside Stack Playground and performed our first buffer overflow, seeing what happens when we ram too much data into something that can’t handle it!
- Decoded the “magic scrolls” of opcodes and used Disassembler to translate the bytes back into something we can actually read!
All of this might sound dumb and light-hearted, and that’s absolutely my aim here with this article.
But make no mistake, these are the real mechanics of what’s happening under the hood of your code.
Not just for OSCP but beyond that, this is the foundation that will take you from using other people’s exploits to writing your own and finding brand-new vulnerabilties no-one else has!
If nothing else, I hope this article made memory as a concept less scary for you. If it has, then I’ve done my job.
Happy bug hunting!